


This article is part of our The Z Files series.
Statcast data has significantly altered the fantasy baseball landscape, with next-level analysis generating the edges necessary to compete. It has even seeped into the mainstream with exit velocity and spin rate the two most cited examples.
Unfortunately, information of this depth is often misunderstood, misapplied, and misrepresented. The following discussion will focus on a batter's exit velocity, with much of the presentation being counterintuitive.
To help understand the research, let's hearken back to Statistics 101. Correlation is a simple, yet powerful tool. It measures the linear dependency of two sets of data. As one set of data progresses, how closely does the other set progress in the same manner?
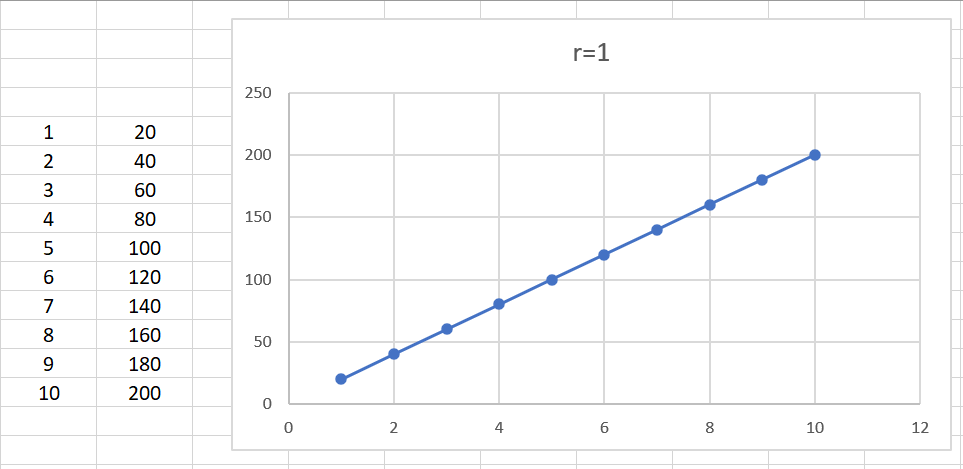
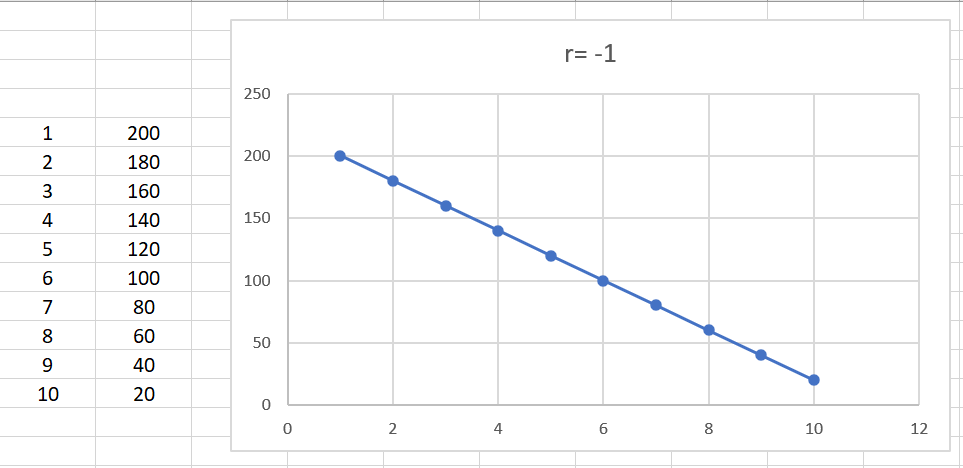
Most of the ensuing studies will rely on a correlation coefficient, denoted as "r". When r=1, there is perfect agreement between the two sets of data. When r=-1, there is perfect disagreement. If r=0, the relationship between the two sets is perfectly random. Here are graphical examples of each, using the same data set in different orders:
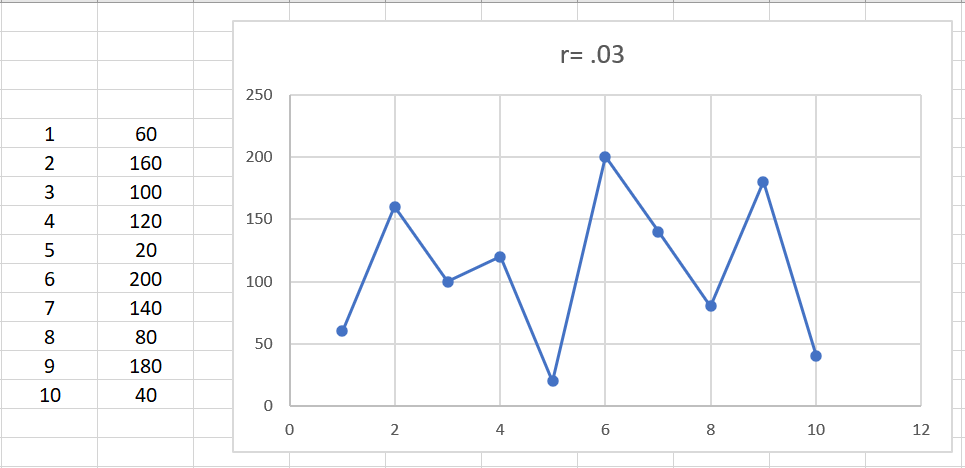
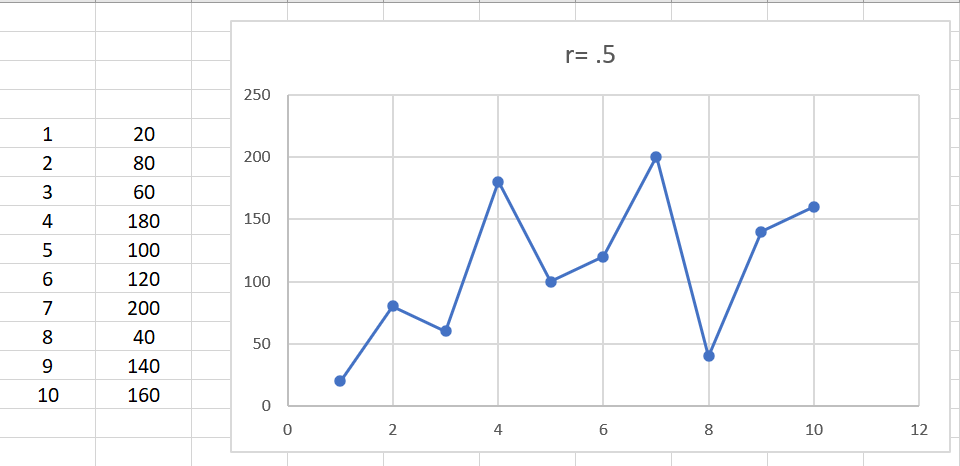
The last chart was included to help gain perspective. It's hard to see a difference in correlation by eyeballing the r=.03 and r=.5 graphs. However, there are nine relationships between adjacent data points in each. In the r=.03 example, the later data point is greater than the earlier data point only four times (44%). In the r=.5 example, the later point exceeds the one before six times (67%). This explains the random nature of the r=.03 data set and the partial correlation with the
Statcast data has significantly altered the fantasy baseball landscape, with next-level analysis generating the edges necessary to compete. It has even seeped into the mainstream with exit velocity and spin rate the two most cited examples.
Unfortunately, information of this depth is often misunderstood, misapplied, and misrepresented. The following discussion will focus on a batter's exit velocity, with much of the presentation being counterintuitive.
To help understand the research, let's hearken back to Statistics 101. Correlation is a simple, yet powerful tool. It measures the linear dependency of two sets of data. As one set of data progresses, how closely does the other set progress in the same manner?
Most of the ensuing studies will rely on a correlation coefficient, denoted as "r". When r=1, there is perfect agreement between the two sets of data. When r=-1, there is perfect disagreement. If r=0, the relationship between the two sets is perfectly random. Here are graphical examples of each, using the same data set in different orders:
The last chart was included to help gain perspective. It's hard to see a difference in correlation by eyeballing the r=.03 and r=.5 graphs. However, there are nine relationships between adjacent data points in each. In the r=.03 example, the later data point is greater than the earlier data point only four times (44%). In the r=.5 example, the later point exceeds the one before six times (67%). This explains the random nature of the r=.03 data set and the partial correlation with the r=.5 numbers.
Class dismissed, let's talk some hardball.
What follows is a series of correlations, most involving the relationship between component average exit velocity (AEV) and component batting average on balls in play (BABIP). The batted ball components studied are
- Hard ground balls (HGB)
- Soft ground balls (SGB)
- Infield line drives (ILD)
- Outfield line drives (OLD)
- Fly balls (FB)
Maximum Exit Velocity
Before getting granular, let's investigate maximum exit velocity (MaxEV). This is often espoused by analysts in a predictive nature as well as commonly mentioned during baseball broadcasts. Intuitively, hitting a baseball really hard is a good thing, but what does it tell us about the player?
Here are several correlations between MaxEV and various metrics, using all 2021 hitters with at least 50 batted balls in play:
| BABIP | 0.15 |
| Launch Angle | 0.04 |
| HR% | 0.55 |
| wOBA | 0.43 |
HR% is home runs per plate appearance, while wOBA is weighted on base average. wOBA is a soupedup version of standard on base percentage where each component is assigned a coefficient accounting for how much it contributes to scoring a run. It's a good catch-all metric to reflect a hitter's production.
MaxEV correlates best to power. However, it is often cited as a leading indicator for batting average, but the data indicates it has a very small effect. If someone uses MaxEV to predict a power surge, there is some basis, but it shouldn't be the primary driving force.
Note the correlation between MaxEV and launch angle is essentially random. Here is the percentage each batted ball type garnered a player's MaxEV:
FB | HGB | ILD | OLD |
20.2% | 30.4% | 4.6% | 44.8% |
This speaks towards the various swing trajectories. Let's channel Physics 101. Submarine pitchers aside, the baseball is always moving downward as it approaches the hitter. The closer the swing path matches the direction of the ball, the higher the exit velocity. That is, if an uppercut swing and a flat swing center a pitch, a slightly uppercut swing likely generates a higher exit velocity since its path is closer to the movement of the pitch. Flatter swings generate more ground balls, slightly uppercut swings lead to line drives while fly balls emanate from swings with more uppercut.
Cycling back to the predictive capability of MaxEV, expecting more power from a groundball hitter with a career-best MaxEV is a misapplication of the data. It may be viable for a flyball hitter, but as will be shown, there are other more relevant determinants.
Component Average Exit Velocity
Logically, hitting the ball harder should result in more hits, right? Let's look at the relationship between average exit velocity (AEV) and BABIP for the five batted ball types under investigation. Data from 2016-2021 (excluding 2020) will be presented. The following minimum number of balls in play (BIP) were needed to be included in the study:
- Hard ground balls - 50 BIP
- Soft ground balls - 10 BIP
- Infield line drives - 10 BIP
- Outfield line drives - 50 BIP
- Fly balls - 50 BIP
Hard Ground Balls
| Year | r |
|---|---|
| 2016 | 0.19 |
| 2017 | 0.20 |
| 2018 | 0.29 |
| 2019 | 0.28 |
| 2021 | 0.18 |
Hmm, maybe the exit velocity of grounders isn't as important as some expect. Sure, there is a positive relationship, but it isn't strong, especially in 2021. To help visualize this level of correlation, here is graphical representation of the 2021 data:
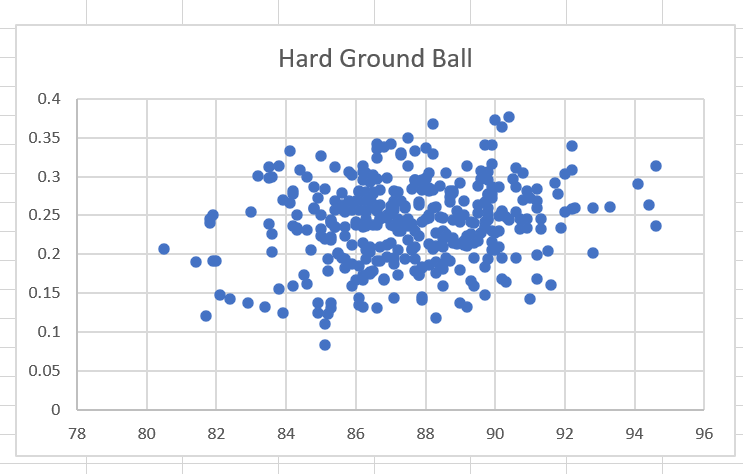
Are you comfortable stating a player with a 25th percentile GB BABIP should be projected higher based on a 75th percentile GB AEV? I'm not.
Soft Ground Balls
| Year | r |
| 2016 | 0.09 |
| 2017 | 0.15 |
| 2018 | 0.07 |
| 2019 | 0.02 |
| 2021 | -0.12 |
AEV is even less significant on softly hit groundballs, which makes intuitive sense. Shouldn't foot speed dictate the BABIP on grounders, especially those of the soft variety?
Sprint Speed
Here are the correlations between sprint speed and HGB and SGB using 2021 data:
| Hard Groundball | 0.31 |
| Soft Groundball | 0.22 |
Personally, I expected a stronger relationship, especially with SGB. These results indicate there is a chance a fast runner is sporting an unlucky GB BABIP, but it isn't enough to feel warm and fuzzy about expecting a correction.
Infield Line Drives
| Year | r |
|---|---|
| 2016 | 0.01 |
| 2017 | 0.06 |
| 2018 | 0.02 |
| 2019 | 0.13 |
| 2021 | 0.05 |
This makes perfect sense. The placement of the ILD, and not the velocity, dictates its fate. For those wondering, the typical ILD BABIP is around .130, so most are caught.
Outfield Line Drives
| Year | r |
|---|---|
| 2016 | 0.26 |
| 2017 | 0.22 |
| 2018 | 0.30 |
| 2019 | 0.21 |
| 2021 | 0.29 |
We're back to a positive correlation, a bit stronger than HGB, but still not as substantial as one might intuit. Again, hitting an OLD harder increases the probability it is a hit, but the relationship is still not sufficient to be comfortable predictive.
Flyballs
| Year | r |
|---|---|
| 2016 | -0.03 |
| 2017 | -0.12 |
| 2018 | -0.02 |
| 2019 | -0.18 |
| 2021 | -0.16 |
Keeping in mind a negative correlation indicates an inverse relationship, while it is weak, the data suggests a softly hit flyball has a better chance to land safely compared to a well struck flyball. While this may not be intuitive, upon further review it makes sense considering softly hit fly balls will land in front of outfielders playing deep.
Keep in mind BABIP excludes home runs. While softly hit flyballs may slightly aid BABIP, well hit flyballs have to promote power, right?
Power
The following is derived from 2021 data but is representative of every season. Here are the correlations for pertinent power indicators. Keep in mind average flyball distance portends homers much better than average home run distance:
| HR% | 0.79 |
| HR/FB | 0.81 |
| FB Distance | 0.92 |
Okay, now we're getting somewhere. A high FB AEV should yield more long balls. Here is the visual extent FB AEV correlates to FB Distance:
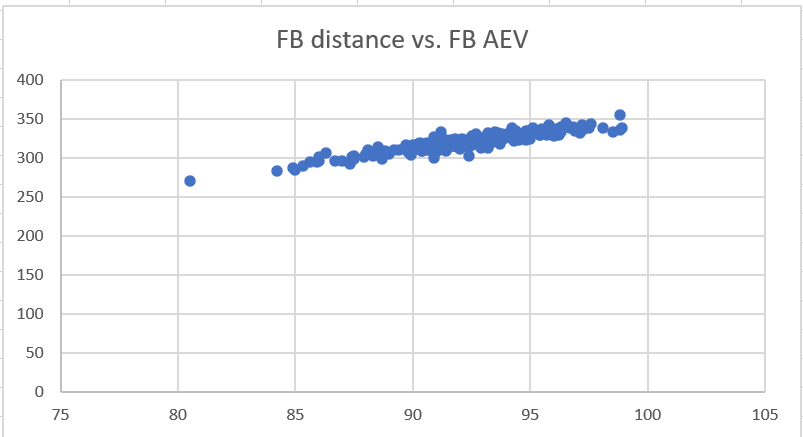
Compare this to the Ground Ball scatter plot. FB AEV is clearly a confident precursor for home run output.
SUMMARY
- MaxEV is a much better predictor for power than batting average
- Flyball AEV is even better than MaxEV for gauging power potential
- Hard Groundball AEV slightly influences BABIP, while Soft Groundball AEV has no effect
- Foot speed helps increase Groundball BABIP, but not very much
- Outfield Line Drive AEV matters, but not as much as may be perceived
- A lower Fly Ball AEV ever so slightly increases the chances of the flyball landing safely
Sorry friends, we're not done. There are two pink elephants having a staring contest, wondering which I'll address first.
Platoon Splits
BABIP is a function of defensive positioning and with the proliferation of the shift, it needs to be accounted for in research of this nature. Additionally, left-handed batters have both an inherent advantage and disadvantage with respect to beating out grounders. They're a step or two closer to first base, which is obviously a good thing, but they pull more balls to the right side of the infield, shortening the throw to first base. On the other hand, when there is a runner on first, there may be a bigger hole on the right side if the first baseman is holding the runner.
Here is the platoon split data, correlating Hard Groundball AEV and Hard Groundball BABIP for LH and RH batters:
| Year | LHB | RHB |
|---|---|---|
| 2021 | 0.12 | 0.18 |
| 2019 | 0.22 | 0.30 |
| 2018 | 0.31 | 0.24 |
| 2017 | 0.13 | 0.18 |
| 2016 | 0.07 | 0.21 |
The same minimum 50 BIP was utilized for this study, so the results don't sync with those posted above for all hitters since the pools are different. Keeping in mind this does not distinguish between batters incurring more shifts, Hard Groundball AEV may be a tad more predictive for right-handed batters, but the correlation is still small. The other point to remember is this solely reflects the correlation between AEV and BABIP, and not the actual BABIP itself. To emphasize that, here are the corresponding BABIPs for the data set:
| Year | LHB | RHB |
|---|---|---|
| 2021 | 0.228 | 0.250 |
| 2019 | 0.233 | 0.250 |
| 2018 | 0.234 | 0.255 |
| 2017 | 0.245 | 0.257 |
| 2016 | 0.241 | 0.263 |
Please note this includes all balls in play. It doesn't really contribute to the study at hand, but it may satisfy some curiosity.
Parsing the data by shifts is beyond the scope of this research. Not to mention, there is a difference between defensive positioning and a shift. Generally, a shift is considered to be an uneven number of infielders on either side of second base and/or an infielder playing on the outfield grass and not the infield dirt. For instance, positioning the shortstop just to the left of the second base bag is not a shift, but it helps guard against hits up the middle.
The main takeaway here is that the notion Groundball AEV isn't very predictive of BABIP applies to both lefty and righty swingers.
That takes care of one of the elephants. The other appears to be more concerned with pitching. Thus far, all the discussion has pertained to the hitting side of the ledger.
Pitching and Average Exit Velocity
Just as it is assumed it is beneficial for hitters to generate hard contact, pitchers should strive to induce weak contact. However, the truth dovetails with the results for hitters. That is, inducing weak contact on groundballs isn't a requisite for success, but doing so on fly balls keeps the ball in the yard, which is obviously a good thing.
This does not speak towards the argument whether a pitcher has the ability to consistently generate weak contact. To be honest, it may even render it moot if the pitcher is a groundball specialist. What is clear is the correlation between a pitcher's AEV and BABIP is minimal, but it increases when compared to wOBA. A deeper study is required, breaking the batted balls into components, but here are the results for aggregate balls in play.
| 2021 | 2019 | 2018 | 2017 | 2016 | |
|---|---|---|---|---|---|
| BABIP | 0.14 | 0.16 | 0.23 | 0.21 | 0.17 |
| wOBA | 0.35 | 0.38 | 0.42 | 0.39 | 0.35 |
ELEPHANT IN THE ROOM SUMMARY
- The conclusions presented earlier are applicable to both left-handed and right-handed batters, with the caveat that accounting for the defensive shift hasn't been reflected in the data
- Preliminary studies indicate it is much more beneficial for a pitcher to induce weak contact on flyballs than on grounders